Six municipalities contributed data from 40 locations, resulting in more than 5,000 water quality observations across 60 water quality parameters.
2025
Watershed Trends
The Keep It Clean Partnership (KICP) launched a collaborative monitoring program in 2014 to gather water quality data across the Boulder and St. Vrain watersheds. Today KICP is made up of six partner communities: the cities of Boulder, Longmont, Louisville, and Lafayette, the Town of Superior, and Boulder County. KICP staff collaborate with these communities and other organizations with the goal of improving watershed health.

To support watershed health, KICP uses water quality data to evaluate annual and long-term trends throughout the Boulder St. Vrain watershed. These data provide information on the overall health of the watersheds, water quality in our creeks and the impacts of watershed management efforts. Read more about the KICP collaborative monitoring program on the KICP website.
See the list of definitions for the water quality parameters mentioned in this report.
Keep It Clean Partnership Partners


Monitoring Locations Map
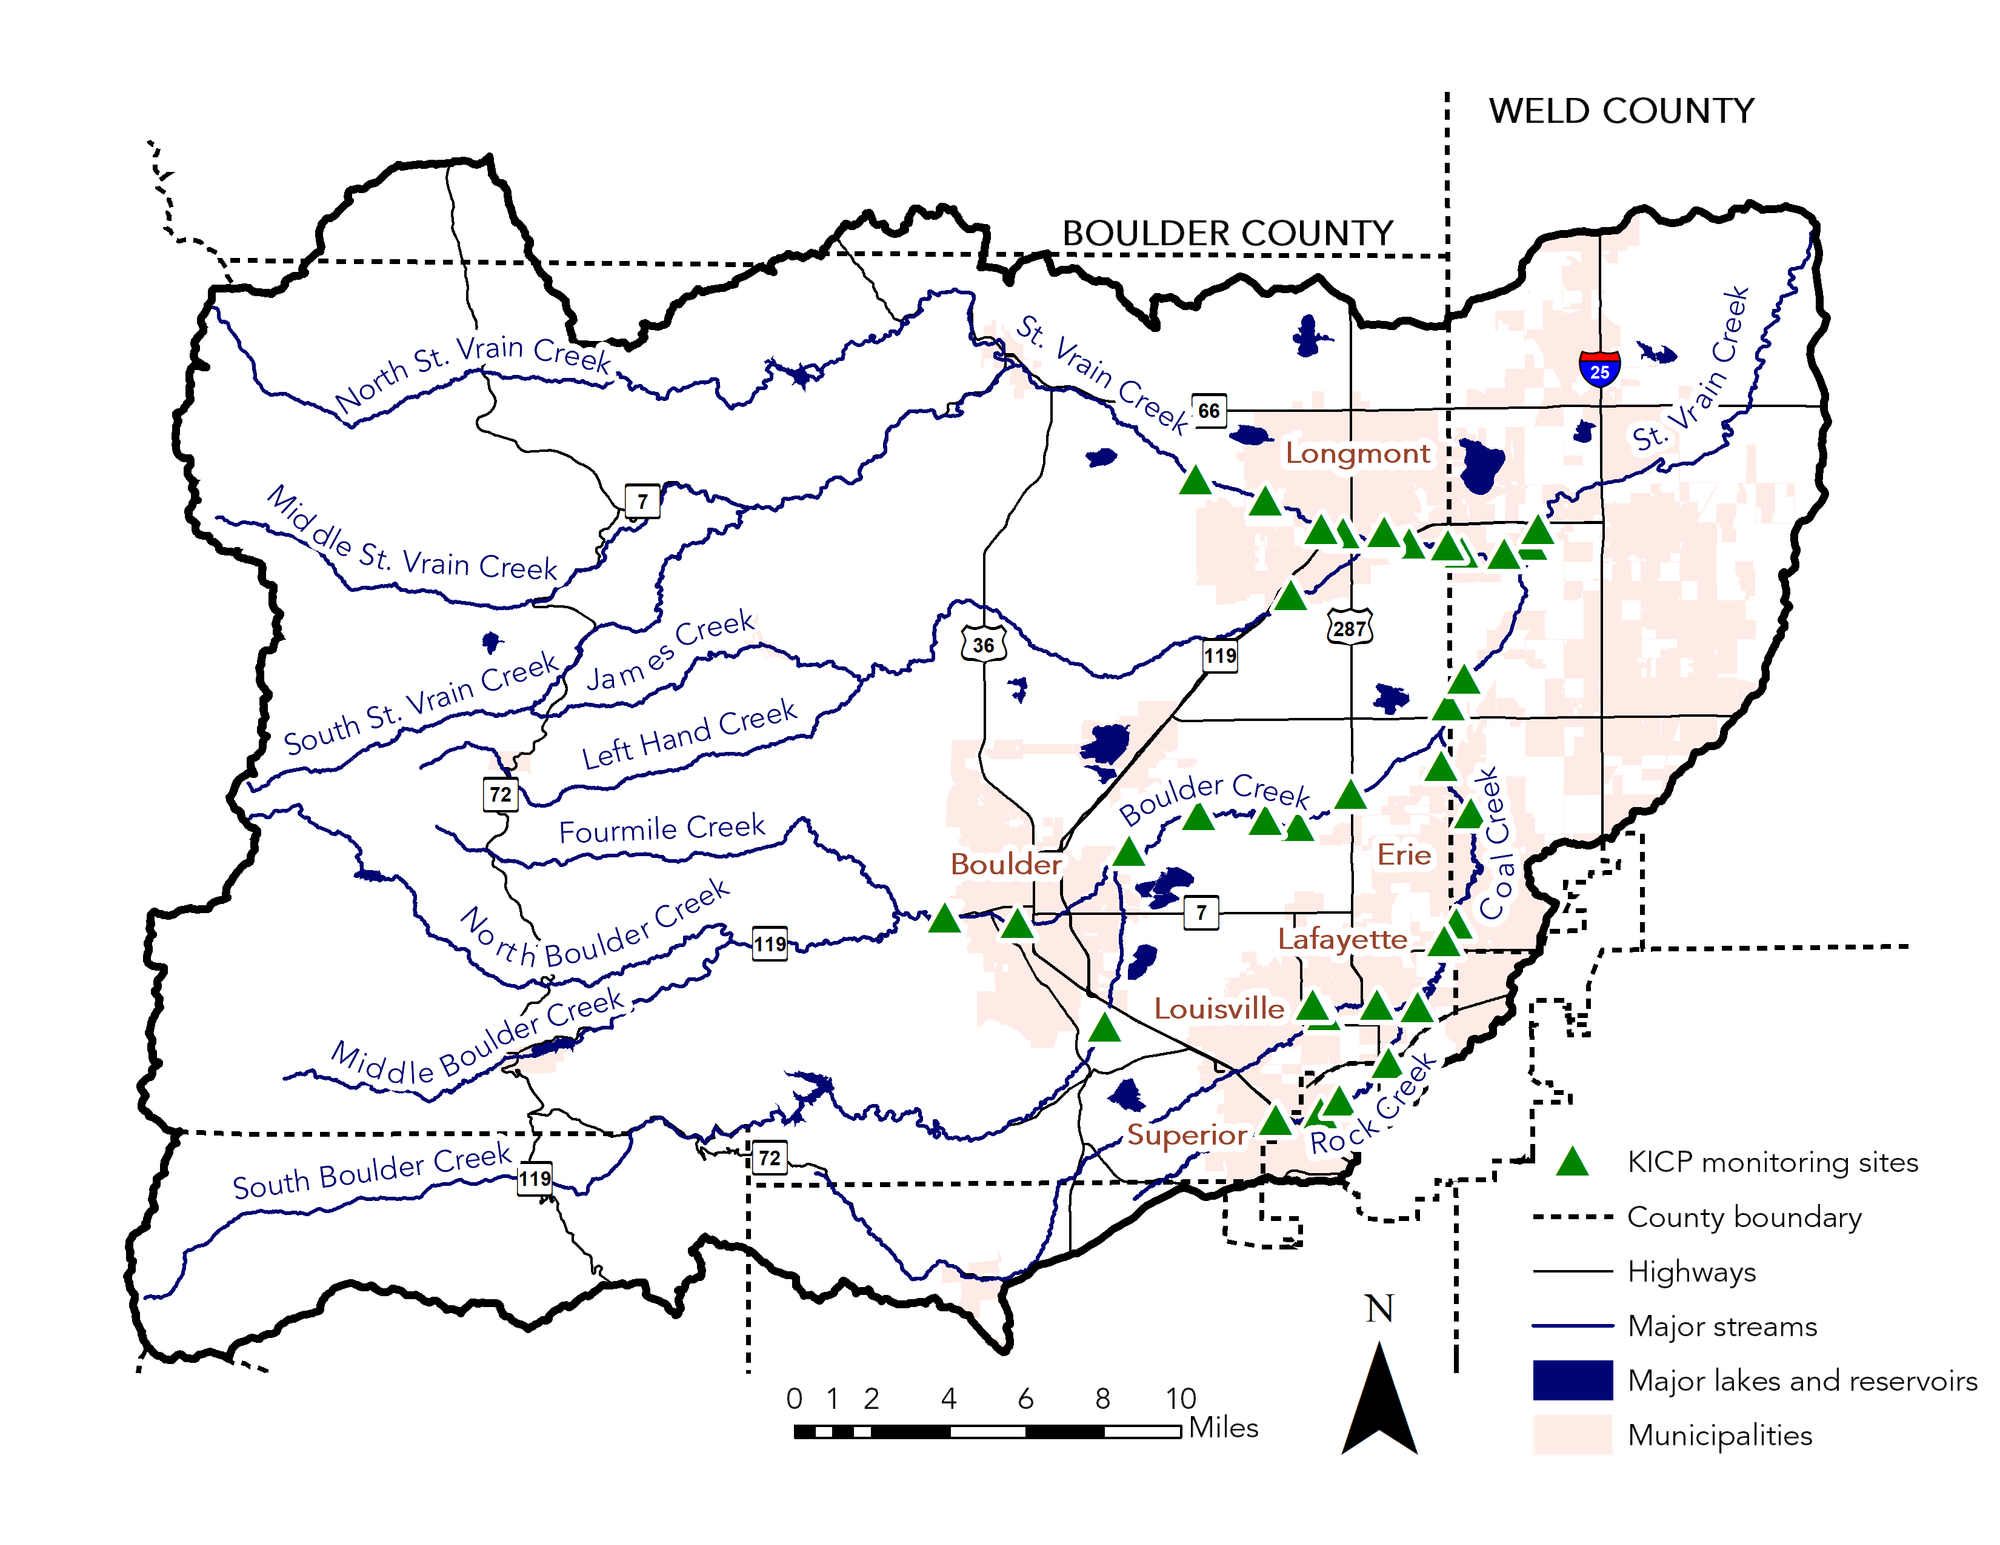
The map below shows where the KICP Partners monitor water quality in the watershed. Visit the interactive monitoring locations map to see the data we have collected at each site.
Data Reporting
The KICP compiles and manages their historical water quality dataset in a centralized database that supports interactive online tools for exploring the data and highlighting annual and long-term trends. This report highlights notable observations and trends by comparing the most recently collected data to the previous 5 years.
This report and previous reports may be viewed or downloaded on the Water Quality Dashboard or by contacting Cristina Ramirez at [email protected].
Data Collection Facts
Partners' monitoring efforts are focused on addressing pollution through compliance with their respective municipal stormwater (MS4) and wastewater (NPDES) permits. As opportunities arise, partners may consider expanding monitoring efforts to better understand and reduce non-point source pollution.
Data collected through this monitoring program is voluntary and is used to understand watershed health and major trends; this data is not intended for regulatory purposes.
Watershed Water Quality Characteristics
Analyzing over 20 years of water quality monitoring information provides insights into water quality trends that characterize the Boulder St. Vrain watershed. These characteristics are presented here, organized categorically by:
General Water Quality
General water quality parameters include a combination of both physical characteristics (e.g., temperature, pH, suspended solids, etc.) and general chemistry (e.g., alkalinity, conductivity, dissolved organic carbon, etc.) of the water. Many of these parameters are related to each other and can indicate when activities are impacting stream water quality.
Key influences on these water quality parameters tend to include high flows from spring rain, snowmelt runoff, and storm events. High flow conditions often dilute certain parameters, including hardness, alkalinity and conductivity, which are influenced by multiple factors, including natural geologic conditions. High flow events can also transport sediment, stir up stream beds and erode stream banks, leading to increased suspended solids.
In the Boulder St. Vrain watershed:
pH and Dissolved Oxygen Periodic exceedances of the pH standard can occur, typically when DO concentrations are high. During periods of increased photosynthesis, aquatic plants remove carbonic acid from the water as they take up carbon dioxide. This reduces acidity and causes pH to rise.View pH BoxplotsView Dissolved Oxygen Boxplots
Hardness is strongly influenced by the soft water of spring snow runoff, which lowers hardness (as well as alkalinity and conductivity) in April, May and June.View Hardness Graphs
Sulfate is only monitored in the St. Vrain. Levels are reduced during spring runoff, but they do rise steadily from upstream-to-downstream. Factors influencing this trend are not known but likely related to natural hydrogeology.View Sulfate Graphs
Total Suspended Solids are generally low throughout all the streams. Higher levels tend to correlate with increased flow conditions due to seasonal runoff and elevated precipitation, which temporarily stir up solids from the stream bottom.View TSS Graphs
Alkalinity and Conductivity values are highest in upper Coal Creek but still at healthy levels, likely influenced by natural geology. These parameters tend to increase upstream-to-downstream. However, Louisville treated effluent tends to lower conductivity in Coal Creek.View Alkalinity GraphsView Conductivity Graphs
Dissolved Organic Carbon serves as a primary food source for many aquatic microorganisms. High concentrations can indicate organic pollution. DOC levels in Boulder and St Vrain creeks are healthy in all monitoring locations. DOC is not monitored in Coal Creek.View DOC Graphs
Nutrients
Understanding nutrient concentrations in streams is crucial due to their significant impact on water quality and aquatic ecosystems. Excessive nutrients, such as nitrogen and phosphorus, can lead to eutrophication in waterways. Eutrophication is a process where waterbodies become overly enriched with nutrients, causing excessive growth of algae and other aquatic plants and leading to depleted oxygen in a water body. Ultimately, eutrophication can lead to fish kills and harmful algal blooms.
Elevated nutrient levels can also cause imbalances in the ecosystem, affecting the diversity and health of aquatic species. Monitoring and managing nutrient concentrations are essential to maintaining healthy watershed ecosystems and ensuring safe water quality for various uses.
Common sources of nutrients include fertilizers, detergents, pets and farm animals, treated wastewater, and leaking sewers and septic systems. Mitigating or preventing inflow of nutrients to the watershed will continue to be a major focus in the future.
In the Boulder St. Vrain watershed:
Domestic wastewater treatment facilities are one of the primary sources of nutrients in the Boulder St. Vrain watershed. Colorado regulates these facilities by limiting how much nitrogen and phosphorus they can discharge into streams. Wastewater treatment facilities in this watershed have invested significantly in reducing nutrients in treated effluent, and positive impacts from these investments can be seen in both St. Vrain and Boulder Creeks.
Nitrogen and Phosphorus increase upstream-to-downstream throughout the watershed, influenced predominantly by treated effluent discharge. Effluent concentrations have been stable or slightly reduced in the past decade.View Total Nitrogen GraphsView Total Phosphorus Graphs
Ammonia concentrations have been stable or slightly reduced over the past decade across most locations. Notably, ammonia levels have been declining below the Longmont wastewater treatment facility on the St. Vrain Creek since 2020.View Ammonia Graphs
E. coli
Escherichia coli (E. coli) is a large and diverse group of bacteria that typically live in the digestive tracts of warm-blooded animals. Most strains of E. coli are harmless, but persistently high levels can indicate an increased risk of illness when recreating in a waterbody. E. coli concentrations provide information about the possible presence of pathogens but not about where the E. coli is coming from. Typical sources of E. coli in urban streams include wildlife, pets, trash, leaking wastewater infrastructure and people recreating in or camping near streams.
Learn more about E. coli from the Keep It Clean Partnership
In the Boulder St. Vrain watershed:
E. coli exceedances are a common problem across the Front Range, Colorado, and the United States. All streams monitored by KICP periodically exceed levels that the U.S. Environmental Protection Agency deems safe for recreational use.View E. coli Graphs
Recreate safely: Exposure to E. coli and other microorganisms is a risk when wading or swimming in any natural water body. Most types of E. coli do not cause illness, but there are strains that can cause gastrointestinal illness, and E. coli can be an indicator of other pathogens that can make people sick.Learn how to recreate safely when swimming in lakes and creeks
Metals
Monitoring metal concentrations in streams is important due to the potential toxicity and harmful effects of many metals on aquatic ecosystems and human health. Elevated levels of metals including arsenic, copper, and selenium can contaminate water sources, posing risks to both wildlife and people who depend on these waters for drinking, fishing, and recreation. Metals can accumulate in the tissues of aquatic organisms or disrupt aquatic habitats, impairing the growth and reproduction of fish and other organisms.
In the Boulder St. Vrain watershed:
Underlying geology appears to be a predominant influence on metal concentrations in this watershed, as metal concentrations increase from upstream to downstream and several spike during spring runoff and high-sediment events.
Old mines in the upper watershed can lead to higher levels of metals in streams, even when they have been inactive for a long time. The specific metals vary depending on the mining operations, but can include silver, copper, iron, and others.
All metal concentrations monitored by the KICP are variable and tend to be higher during low flow periods, but at generally healthy levels throughout the watershed.
Municipal effluent frequently contains trace levels of heavy metals like zinc, copper, chromium, nickel, lead, and cadmium originating from residential plumbing, and commercial or industrial discharges entering public sewer systems. However, municipal wastewater effluent does not typically result in elevated instream metal concentrations in this watershed.
Arsenic has been observed to be steadily decreasing across most Boulder Creek sites over the past decade. The reasons for this are being investigated.View Arsenic Graphs
2025 Observations and Trend Highlights
The following section highlights key observations and trends from the most recent year of data collection and compares them with data from the previous five years (2020–2024). Key trends include:
Evidence that wastewater treatment plant upgrades have led to reduced Total Phosphorus on St. Vrain CreekRead more
Boulder Water Resource Recovery Facility Process Improvements and TradeoffsRead more
A Total Suspended Solids Spike noted in St. Vrain Creek that corresponds to specific elevated metals concentrations at the same locationsRead more
E. coli spikes in Rock Creek that influence elevated levels in Coal Creek below the confluence with Rock CreekRead more
Reduced Total Phosphorus on St. Vrain Creek
Achieving nutrient reductions has been a focus for the basin, including exploring strategies to reduce the impacts of wastewater effluent discharge. In January of 2025, Longmont began a new treatment process to remove phosphorus from the water. The process uses chemicals approved by the Colorado Department of Public Health and Environment to remove the phosphorus from the water and control pH. The impact of this investment in treatment improvement was evident immediately. Significantly reduced levels of Total Phosphorus (TP) in Longmont Wastewater Treatment Plant (WWTP) discharge were observed beginning January 2025, and concentrations remained reduced throughout the year.
A time series plot of TP at the T-EFF station highlights reductions of TP from the plant discharge. It is important to note that the data for Longmont's WWTP effluent presented here are not used for regulatory compliance.
Improvement in the overall TP levels in St. Vrain Creek due to these reductions can also be seen in the average monthly time series for 2025 when compared to the previous 5-year period.
When looking at the same comparison across all locations upstream-to-downstream, the source of the reductions is demonstrably reduced TP at the Longmont WWTP effluent discharge point. The immediate reduction of TP in the creek shows the value of treatment improvement projects in our watershed. This reduction will benefit the fish and other aquatic life in the creek as well as the people that use the water further downstream.
Please note that these data are for informational purposes only. Compliance samples must be collected following very specific criteria. The monthly grab samples collected as part of this collaborative monitoring program do not meet those criteria.
Boulder Water Resource Recovery Facility Process Improvements and Tradeoffs
In 2025 and 2026, the City of Boulder made significant upgrades to its Water Resource Recovery Facility to improve nutrient removal and energy efficiency. The upgrades included enhanced phosphorus removal in addition to biological oxygen demand and nitrogen removal. These improvements will benefit overall water quality and help the plant to comply with future permit limits.
Although ammonia concentrations in the effluent increased during the second half of 2025 as the plant adjusted to the new process, they remained well below the plant's current discharge limits, which are designed to protect aquatic life and range from 1.9 - 8.8 mg/L throughout the year. In addition, the plant's treatment goals have changed, and eliminating ammonia discharge is no longer a primary objective. The updated process is designed to improve both TN and TP removal while also increasing energy efficiency and minimizing the use of treatment chemicals.
The data presented in this report are monthly grab samples intended to show long-term trends. As the plant continues to adjust to the upgraded process, overall nutrient output is expected to decrease. Some individual measures, such as ammonia, may increase slightly as the plant balances multiple treatment goals. Overall, the upgrades are expected to improve nutrient removal, energy efficiency, long-term treatment performance and water quality in Boulder Creek.
Total Suspended Solids Spike in St. Vrain Creek
In December 2025, a spike was measured in Total Suspended Solids on St Vrain Creek. This spike is visible in the average monthly TSS graph.
The average monthly graph does not convey specific information about where in the river this spike occurred, however the TSS upstream to downstream graph for the St. Vrain suggests the increased TSS is limited to the M8.4 and M8.2 locations.
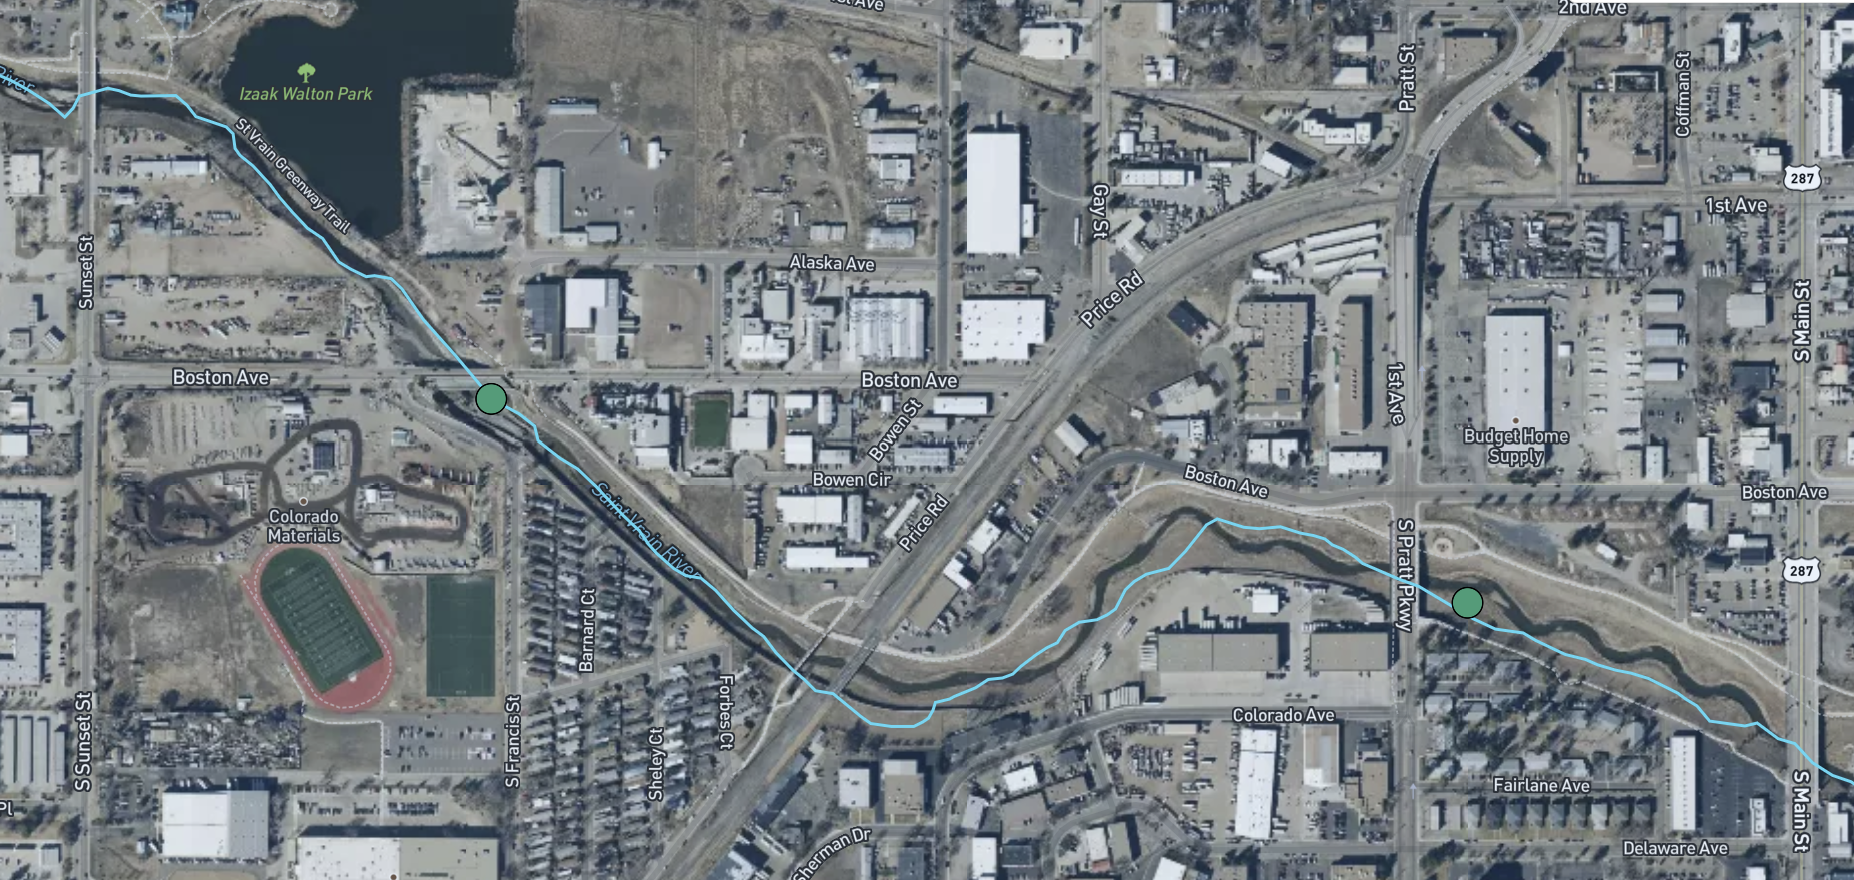
Time series data for these two locations can be viewed from the Map page. Both locations are within the urban stretch of the St Vrain as it passes through Longmont, M8.4-SV just downstream from Boston Ave and M8.2-SV just below S Pratt Parkway. The time series data for M8.4-SV and M8.2-SV shows that TSS was slightly elevated in November but spiked more dramatically in December at both locations.
Elevated levels of Total Aluminum, Total Chromium, and Total Iron were also observed at those same locations, while the dissolved forms of these metals were not elevated. Other metals monitored at those locations during the same month were also not elevated. This is expected with elevated levels of sediment. These metals are naturally present in the rocks and soils near the creek. Higher levels are observed when sediment washes into the creek. Similar but smaller spikes are typically observed during spring runoff.
Ongoing restoration work on St Vrain Creek may explain this spike. Longmont is still working to restore and improve the creek following the 2013 flood. Similar to the City of Boulder's work to improve treatment processes and overall water quality in Boulder Creek, the St Vrain may experience short term impacts during Longmont's work toward long-term watershed improvements.
E. coli Spikes in Rock Creek
A spike in E. coli was noted in the average stream-wide values in June on Coal Creek. Looking at data from upstream to downstream, it is evident that elevated levels of E. coli in Coal Creek only occur below the Rock Creek confluence and therefore appear to be influenced by flows entering from Rock Creek. The cause of this event has not been determined, and it is notable, reviewing the time series data for the Rock Creek station 5-RC, that similar spikes have occurred previously, and since, on Rock Creek.